


What's New
Whats New
Declining Trend in Estimated Sugars Consumption in Canada Continues
Two recent data analyses provide new estimates and trends in sugars consumption in the Canadian population:
1. 2021 Statistics Canada Sugars Availability Data
On May 31, 2022, Statistics Canada released loss-adjusted food availability data for 2021, including updated data on sugars, syrups, and soft drinks, which is collected annually. This data can be used to estimate the availability of added sugars in Canada and serves as a proxy to monitor trends in per capita (per person) added sugars consumption in Canada.
- The estimated per capita added sugars1 consumption in Canada continues to decline, from 10.7 % energy (58.7 g/day) in 2020 to 10.4 % energy (55.3 g/day) in 2021 (see graph below).
- This reflects a continuing long-term declining trend in estimated per capita average added sugars consumption in Canada, with a 21% reduction over the past 20 years (i.e., a decline from 70.4 g/day in 2001 to 55.3 g/day in 2021).
- The largest contributor to the decline in added sugars continues to be the decline in soft drinks availability, which is down by 55% from 2001.
.png)
1Total added sugars estimated from Statistics Canada data on refined sugar, maple sugar, honey and soft drinks (estimated sugars content).
2. New Publication on Trends in Sugars Availability
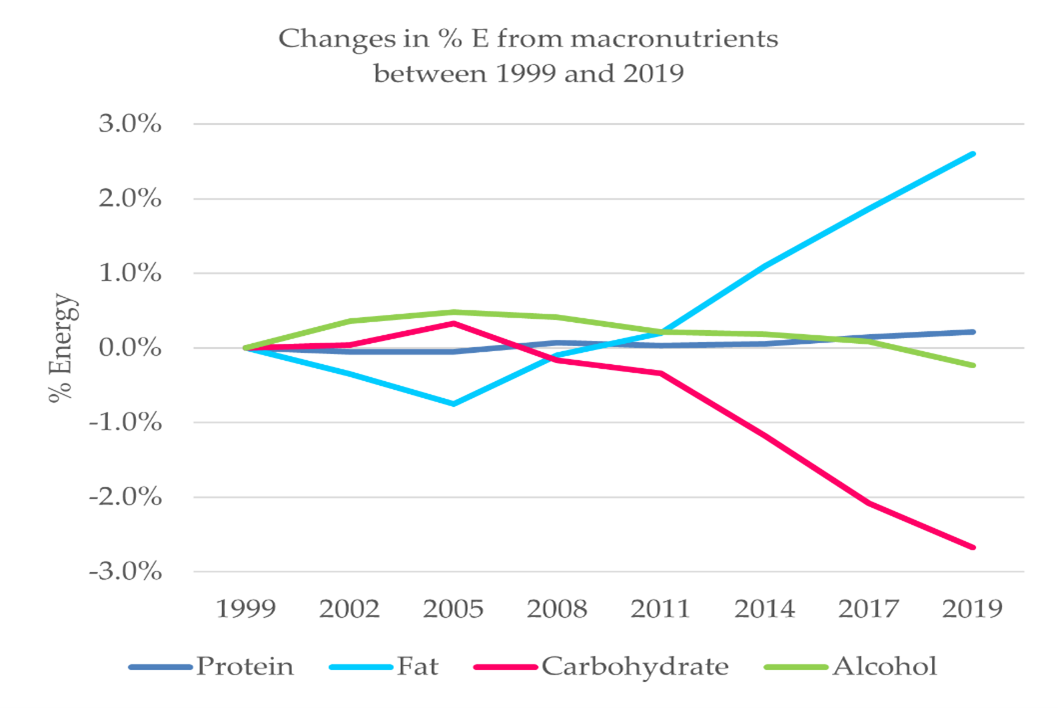
A recent publication in the Journal of the American College of Nutrition by nutrition researchers from the Canadian Sugar Institute and University of Toronto analyzed the consumption trends of added sugars, energy, macronutrients, and food categories in Canada and the United States using food supply availability data.
- There was a 17% decline in loss-adjusted per capita consumption of added sugars in Canada over the twenty-year period from 1999 to 2019. This was largely attributed to reduced intakes of refined sugar and sugars in soft drinks.
- Added sugars intake in Canada was generally 30% less than that in the US.
- There was also a consistent decline in total energy intake and % energy from carbohydrates, accompanied by increased % energy from fats, particularly in the last 10 years (see graph below).
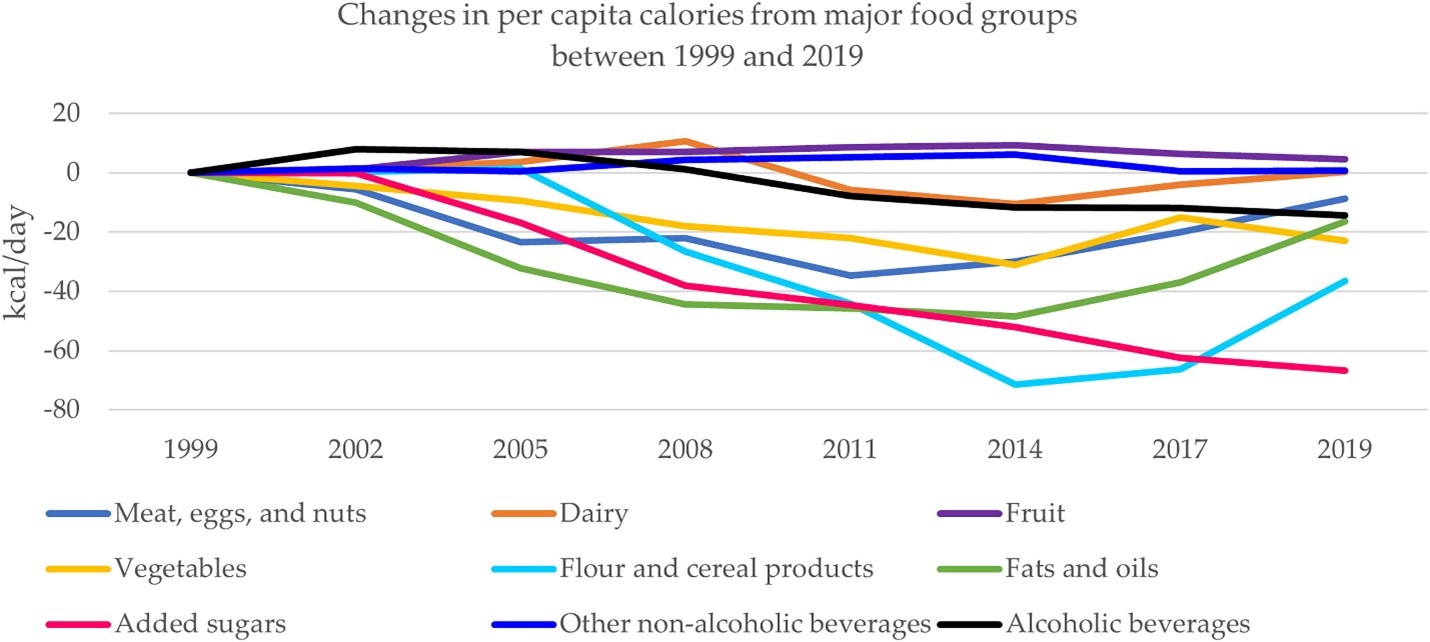
- Absolute intakes (kcal/day) of food categories such as “fats and oils”, “meat, eggs, and nuts”, “flour and cereal products” also declined and remain below 1999 levels, but have shown an increasing trend in more recent years, suggesting a shift in consumer food choices (see graph below).
Additional Resources:
- CSI Webpage: Consumption of Sugars in Canada
- Infographic: Consumption of Sugars in Canada
- Wang YF, Chiavaroli L, Roke K, DiAngelo C, Marsden S, Sievenpiper J. Canadian Adults with Moderate Intakes of Total Sugars have Greater Intakes of Fibre and Key Micronutrients: Results from the Canadian Community Health Survey 2015 Public Use Microdata File. Nutrients. 2020 Apr 17;12(4):E1124.
- Chiavaroli L, Wang YF, Ahemd A, Ng AP, DiAngelo C, Marsden S, Sievenpiper J. Intakes of nutrients and food categories in Canadian children and adolescents across levels of sugars intake: Cross-sectional analyses of the Canadian Community Health Survey 2015 Public Use Microdata File. Applied Physiology, Nutrition and Metabolism. 2022 Apr;47(4):415-428.
- Walton J, Bell H, Re Roberta, Nugent AP. Current perspectives on global sugar consumption: definitions, recommendations, population intakes, challenges and future direction. Nutrition Research Reviews. 2021 Jul. DOI: https://doi.org/10.1017/S095442242100024X